When something breaks in production, logs are often the first place you look. But most backends don’t log the information you actually need when it matters. Either there's too much noise, or the key details are missing entirely.
Let’s walk through what good logging should look like and what you might be missing.
Structured Logging Over Plain Strings
A common issue is logging raw strings with no structure. That might be fine during local development, but it falls apart in production. You can't filter, search, or analyze unstructured logs effectively.
Instead, use structured logging. That means logging key-value pairs in a consistent format, usually JSON. Most log aggregation tools work better this way.
Example (Winston + TypeScript):
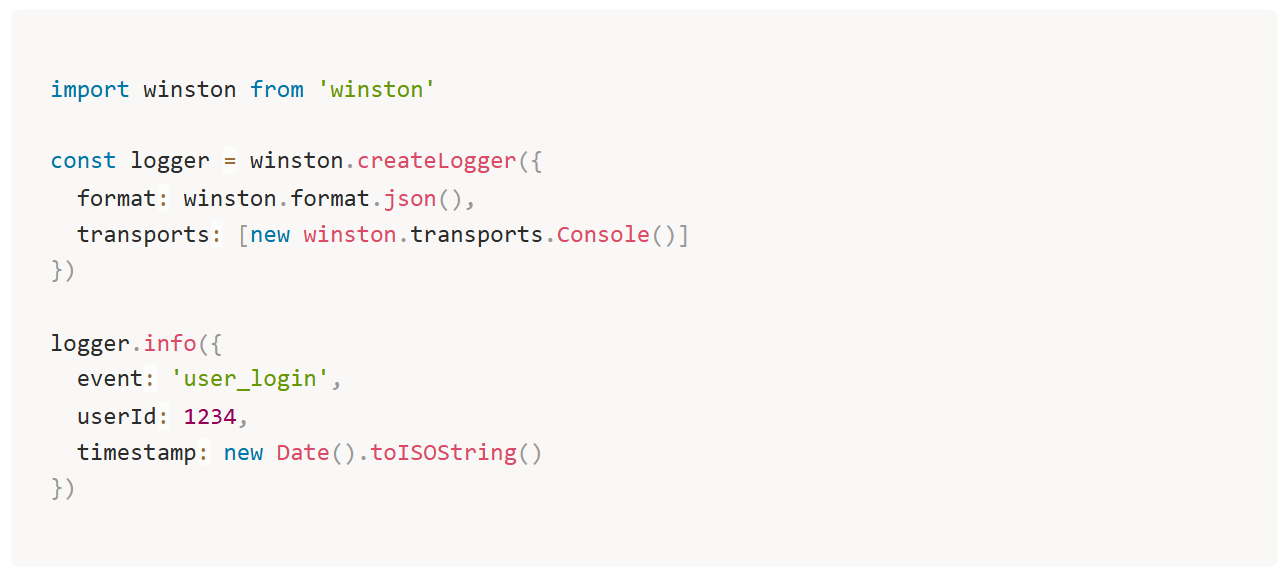
Now logs are easier to query by userId, event type, or time range.
Add Correlation IDs to Track Requests
If a request touches multiple services, you need a way to trace it end-to-end. A correlation ID solves this. It’s a unique identifier added to each request and passed through all services involved.
Without it, you’re stuck reading disconnected log lines, trying to guess what belongs to what.
Example (Express middleware):
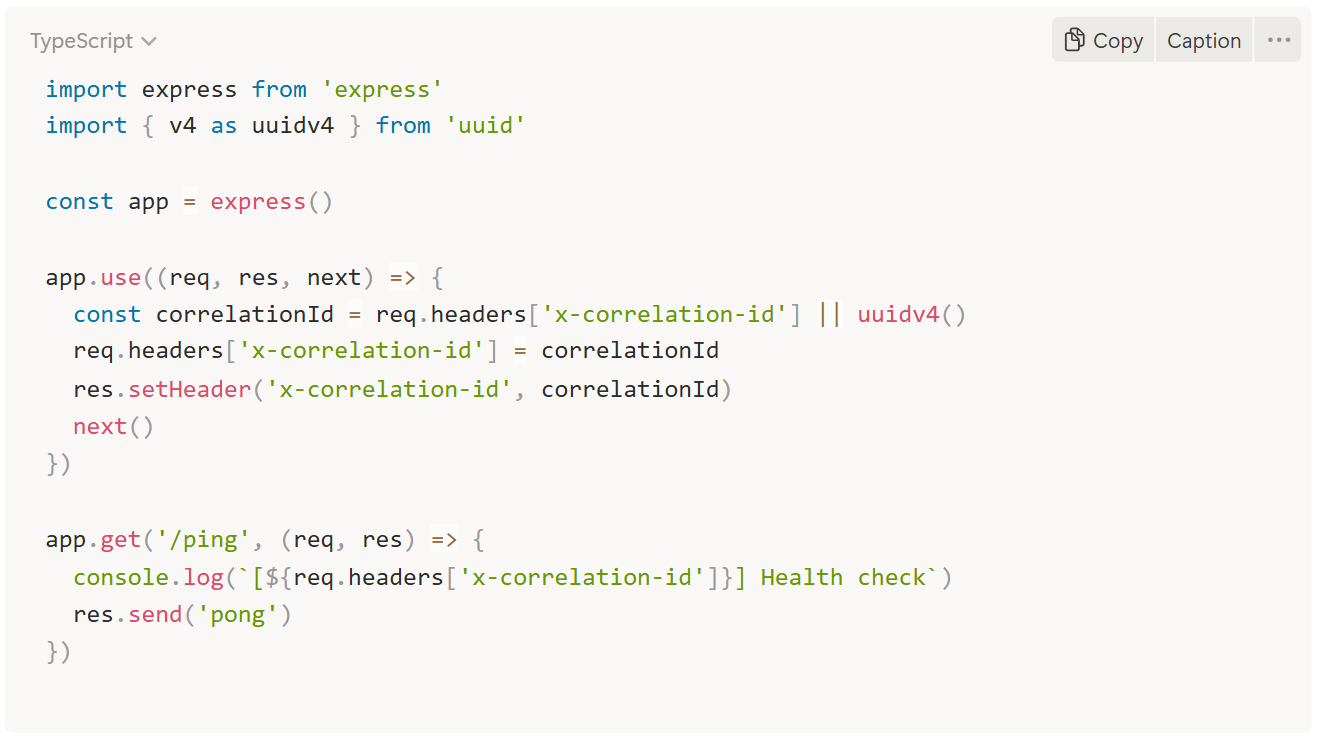
All logs inside that request should include the correlation ID. This makes tracing a request across services straightforward.
Use Log Levels Properly
Not every log message is equally important. That’s what log levels are for. They help you filter logs and focus on what matters depending on the environment.
debug: internal flow details, good for devinfo: high-level app statewarn: something went wrong, but the app recoverederror: a failure occurred that needs attention
Example:
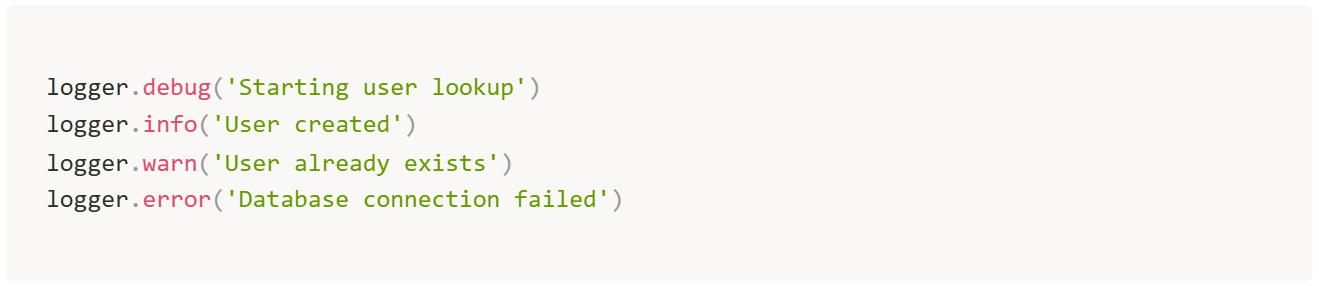
If everything is logged at the same level, it's harder to find the signal in the noise.
Trace Requests Across Services
In systems with multiple services or functions, logging by itself is not enough. You need to trace how a request flows through the system.
This is where distributed tracing tools come in. OpenTelemetry is one way to do it.
Basic example (OpenTelemetry + Express):
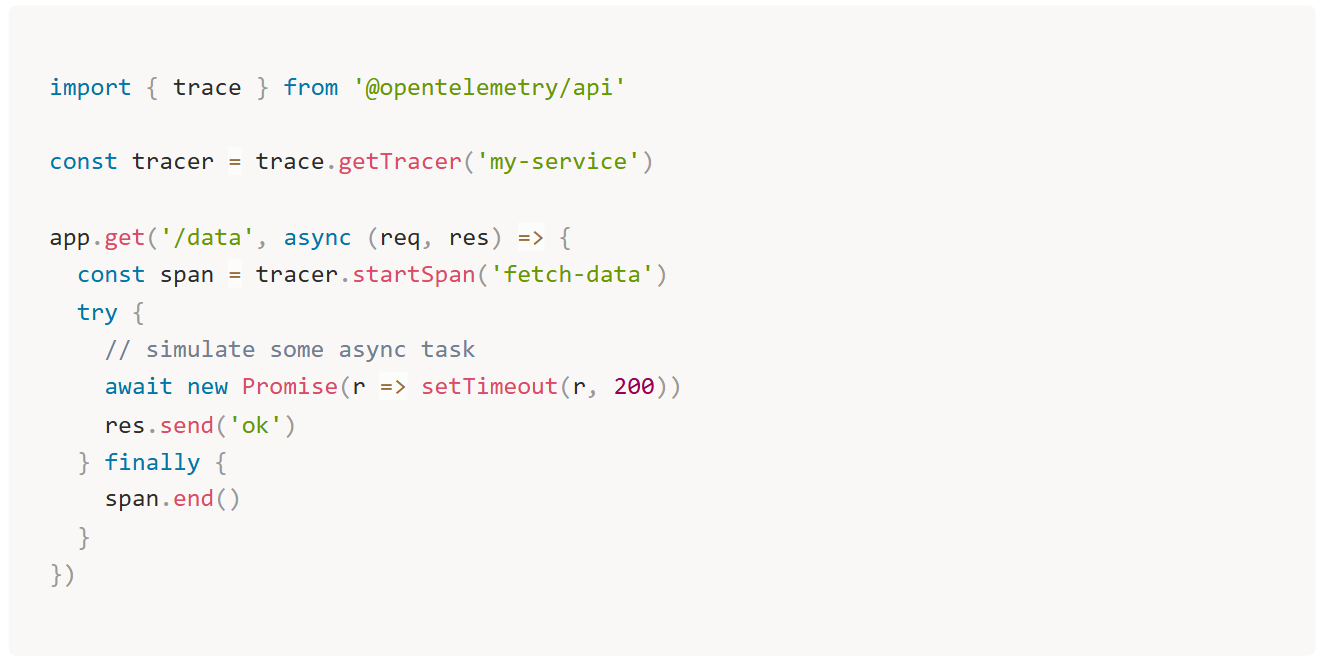
This doesn’t replace logging. It works alongside it to give a bigger picture.
Don’t Log Everything
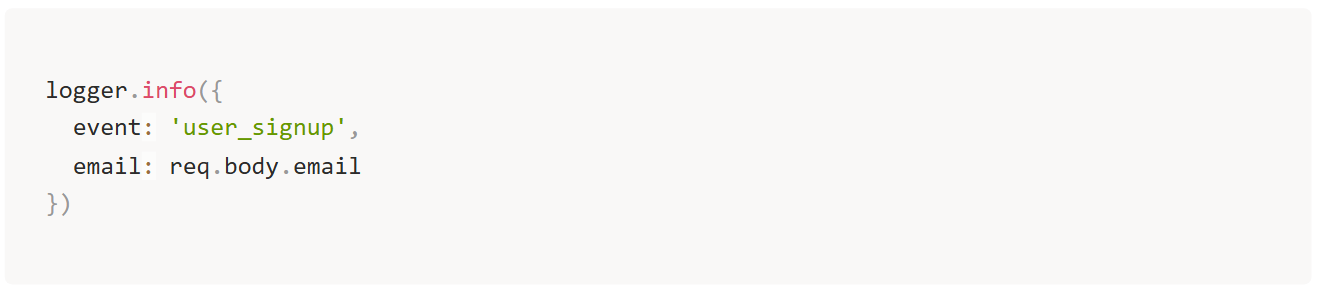
Logging too much can be just as bad as logging too little. You don’t want to spam logs with every database query or request body. It costs more to store, makes analysis harder, and increases the risk of leaking sensitive info.
Be selective. Log enough to understand what happened, but avoid repeating or dumping large payloads unless you really need them.
Bad:

Better:
Centralize and Monitor Logs
If your logs are scattered across services or instances, debugging becomes manual and slow. Use centralized logging platforms like ELK, Datadog, or anything that lets you search, filter, and alert on patterns.
Centralized logs also make correlation IDs and structured formats pay off, since you can trace entire flows from one place.
You can build alerts for repeated error messages or missing expected logs (like failed background jobs).
Final Thoughts
Good logging is not about logging more. It’s about logging the right things, in the right format, with the right context.
If your logs are:
- plain strings
- missing correlation IDs
- all on the same level
- scattered across services
Then chances are you’ll struggle when something breaks.
Start small. Make your logs structured. Add correlation IDs. Use levels. Trace where needed. Centralize it all.
When production goes down, you’ll be glad you did.